
Your retention forecast depends on the part of the company you can see least
For the CFO. About 900 words.
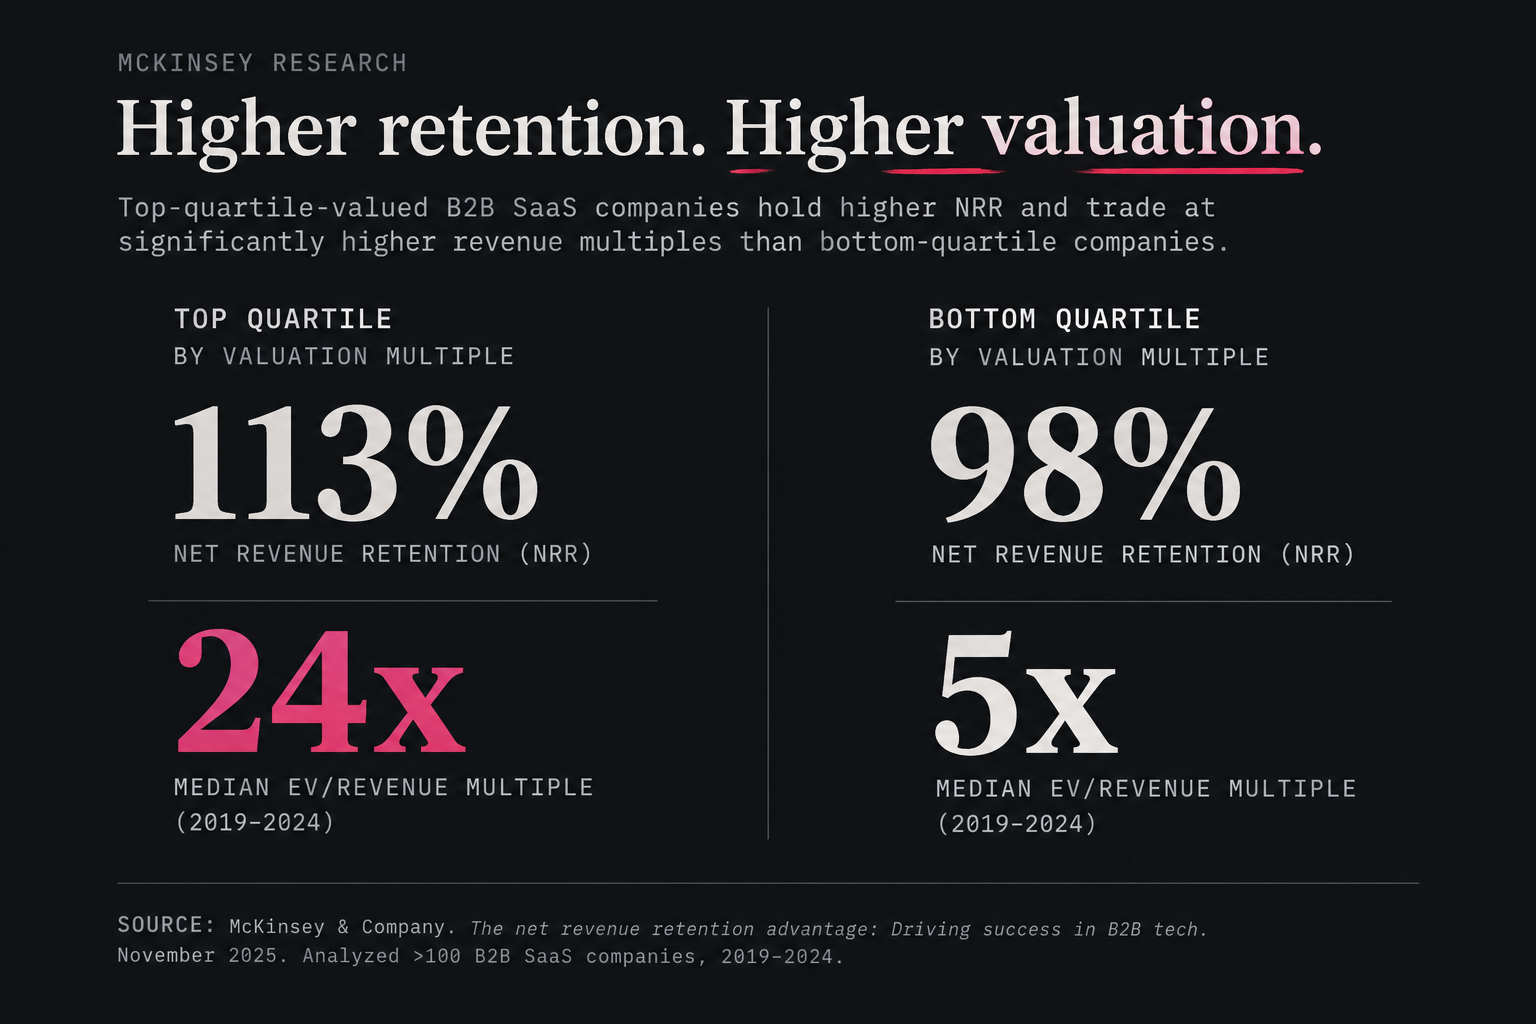
Last November McKinsey published research on what separates the most valuable B2B SaaS companies from the rest. Top-quartile-valued companies held net revenue retention of 113%, and bottom-quartile companies held 98%. From 2019 through 2024, the top group traded at a median of 24 times revenue. The bottom group traded at 5 times.
That 15-point NRR gap sits alongside a striking valuation gap: 24x median revenue for the top valuation quartile versus 5x for the bottom. Much of the operating work that determines whether that revenue is retained or expanded happens after the contract is signed, across implementation, customer success, support, and account management. In the companies I've worked in, those are the teams finance could see least.
Sales efficiency usually arrives with a full set of numbers, down to CAC payback by channel and win rates by segment. Ask the same finance team for cost to serve per account by tier, or how much contract value is sitting behind implementations that missed their go-live date, and the answer is often a request for two weeks.
That gap matters more now than it did a few years ago. Benchmarkit's 2025 benchmark report put median NRR for B2B SaaS at 101%, while median gross revenue retention fell from 90% in 2022 to 88% in 2024. Retention has less room for error, and the forecast that carries it is often built on the least instrumented part of the business.
Where the forecast goes blind
Most retention forecasts I've seen run on two inputs: renewal dates and whatever the account team says in the forecast call. A health score may exist, but it's rarely been tested against what actually happened.
Test it. Take last year's lost and contracted accounts and check what the health score said about each one 90 days before the loss. If most of them were green, the score isn’t doing the job you need it to do. It may be measuring activity rather than actual retention risk. Your forecast is finding out about churn when the cancellation notice arrives, which is also when it's too late to change the quarter.
Where margin leaks without a line item
Post-sales cost rarely shows up where you'd look for it.
Start with unbilled work. When an account gets rocky, implementation and success teams tend to absorb custom configuration and engineering time to keep the customer calm. None of it gets invoiced. Services time entries split billable and non-billable will show you how much, and which accounts get it.
Then look at the go-live date. If billing milestones or services revenue depend on a customer going live, every week of implementation slippage can delay revenue recognition, billing, or value realization, depending on the contract structure. Median days from signature to go-live, by segment, is a number your implementation lead should be able to produce. When it takes a week to assemble, you have learned something important before you’ve even seen the number: implementation performance isn’t being managed as a financial metric.
Last, check the shape of the headcount line. If post-sales headcount grows in step with customer count, the coverage model has no leverage in it. At ShipHero I built the post-sales organization from 5 people to 90 while revenue grew from $50M past $100M, and the only reason the math worked was a pooled, digital-led model for the long tail, with named CSMs reserved for the accounts that justified them.
What the comp plan is paying for
Look at post-sales variable pay for last year and compare it with the outcome on each person's accounts. If bonuses paid out on CSAT or activity targets while those same accounts contracted, the plan may be rewarding satisfaction or activity without adequately rewarding retention. I've designed comp plans at ShipHero and Rackspace, and the fix I've used is to tie the variable component to a number the person can actually move.
Five numbers worth asking for
These are the numbers I'd want in front of me before trusting a retention forecast:
ARR at risk 90 days before renewal, and how the health score performed against last year's actual losses
Median days from signature to go-live, by segment
Unbilled services hours per month, and which accounts receive them
Cost to serve per account, by tier
Share of post-sales variable pay tied to gross or net retention
If your team can hand you all five by Friday, your post-sales operation is better instrumented than most. If they can't, the underlying data usually still exists. It sits in the CRM, the ticketing system, the implementation tracker, and a few spreadsheets that were never joined. A defensible estimate can be built from them, with a clear note on how confident each number is.
If you want to see where your own gaps are, the post-sales scorecard takes about six minutes. Send the revenue and operations sections to your CRO and COO. The places where your answers disagree are a good place to start.
