
What your support volume is trying to tell you
Here is a question I ask operations leaders at SaaS companies in the $20M to $100M range. If your CFO asked this afternoon for monthly ticket volume and cost per contact, how long would it take to answer?
In the teams I’ve worked with, the answer is often measured in days or weeks, not minutes. Support teams get asked for CSAT and first response time, so those are the numbers they instrument. Volume and unit cost stay buried in a ticketing export nobody has time to clean.
Those buried numbers are the ones that explain what support is telling the rest of the company.
Start with cost per contact
A CFO once taught me to treat cost of support as a discipline. You take the fully loaded support cost down to a cost per contact, then keep volume and mix separate because they move for different reasons. Volume tells you how much demand reached support. Mix tells you why that demand exists, which is where the preventable work starts to become visible.
If contact rate rises as the customer base grows, investigate what is generating the additional demand. It may be an onboarding gap, a product defect, a change in customer mix, or a workflow customers consistently struggle to complete.
Sort the volume by who owns the demand
Once you have a year of tickets with categories and timestamps, sort each one by where the underlying demand should have been prevented ro resolved. I use five:
Knowledge and content. Questions a clear article, guide, or in-product explanation could have answered
Training and onboarding. Customers who were never taught the workflow or did not retain it.
Customer Success. Issues that are really about adoption, account strategy, or the customer relationship.
Product and engineering. Defects, usability problems, and design decisions generating support demand.
Support required. Issues that legitimately require support expertise or intervention.
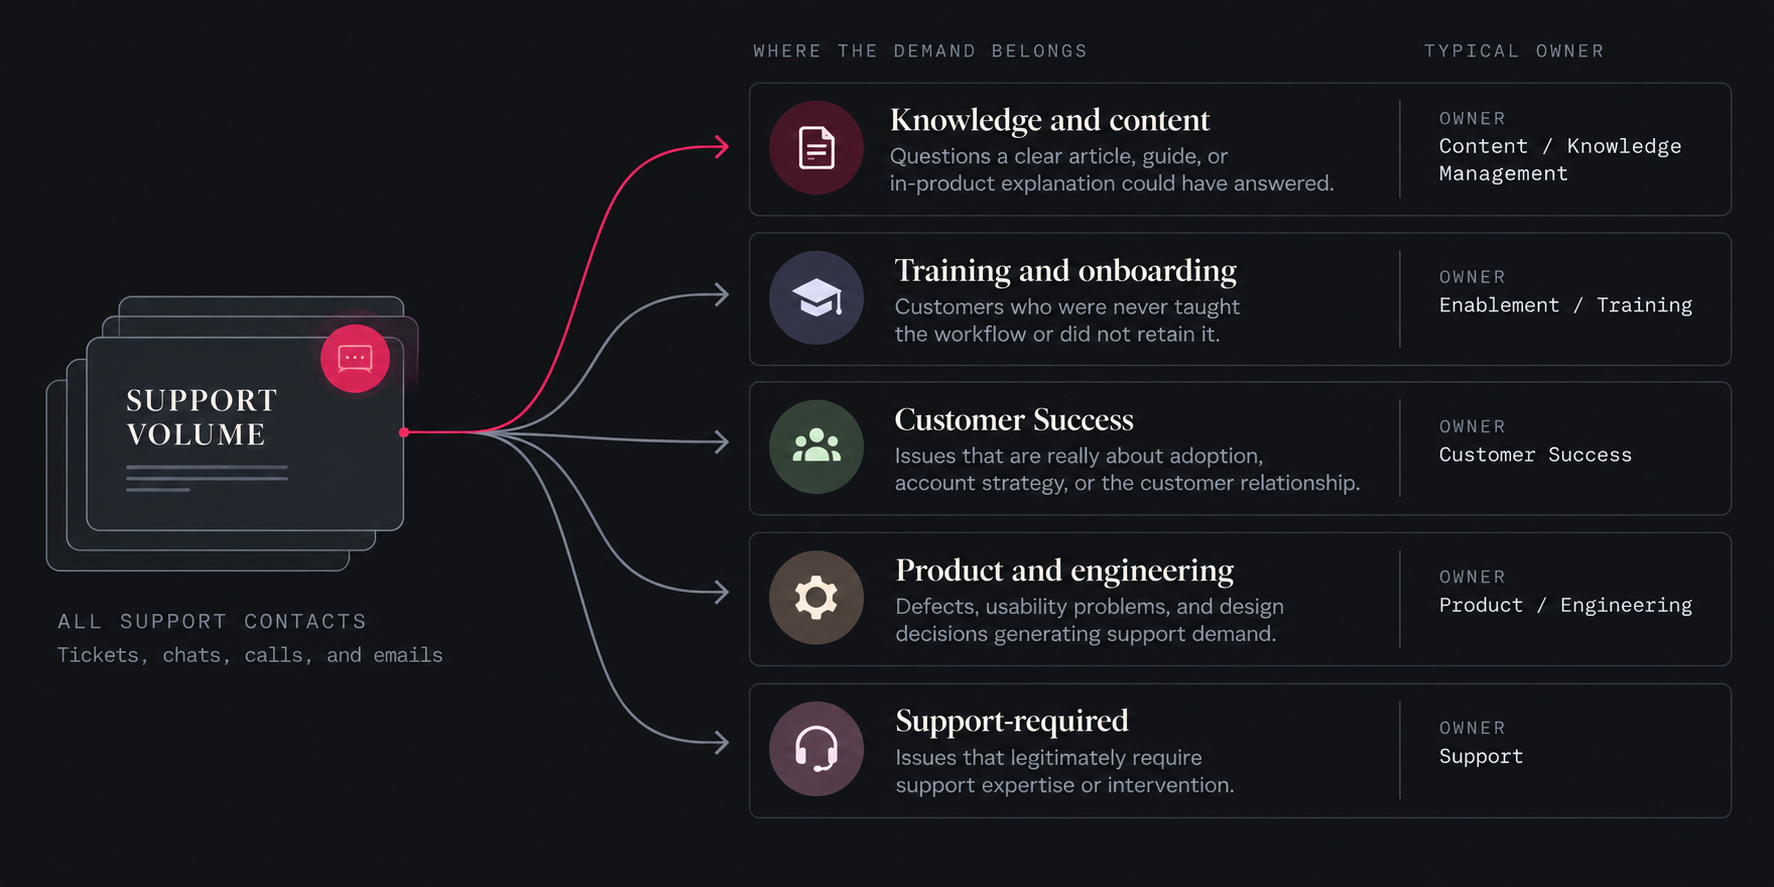
That first pass tells you who owns the work required to reduce demand. Then make a second pass and tag each contact for automation readiness: yes, no, or not yet.
The distinction matters. A contact can belong to product because a defect caused it and still be automation-ready if there is a documented workaround. A training question may eventually disappear through better onboarding, but until it does, AI may be able to resolve it.
Now the analysis answers two different economic questions: How much support demand can we eliminate upstream, and how much of what remains can we serve at a lower unit cost?
Instead of handing support a generic mandate to reduce ticket volume, you can show that a share of demand belongs upstream, then identify how much of the remaining support workload is ready for automation. The cost problem becomes a set of accountable owners and specific levers for reducing it.
Check capacity against what was sold
Multiply monthly volume by average handle time to calculate workload hours. Then compare that demand with productive staffed capacity after accounting for shrinkage and target occupancy. Finally, test whether the resulting staffing model can support the response times promised in customer contracts. When SLAs were set without a capacity model, the gap often surfaces as backlog, missed response targets, sustained pressure on the team, and eventually customer experience problems.
The same math applies to customer success cadences. A promise of monthly business reviews for every account in a tier is a staffing commitment, whether or not anyone costed it.
Close the loop with product
Two more numbers tell you whether support is connected to the rest of the company. The first is the share of tickets linked to an engineering issue, and how many of those get closed back to the customer once the fix ships. The second is the gap in days between a product release and the day customer-facing teams are trained on it. When that gap is wide, customers can encounter new functionality before the people answering their questions are prepared for it, creating avoidable contacts and escalations immediately after release.
Then price the automation
AI support has moved to outcome pricing. Intercom prices its Fin agent from $0.99 per outcome, with the billable outcome defined by what the agent accomplishes in the conversation. AI support pricing is increasingly tied to usage or outcomes rather than seats alone. That makes the business case easier to model, but only if you know your baseline. A per-resolution price only means something next to your current cost per contact and a clear view of which slice of your mix can be automated.
For teams moving from simple support automation into agentic AI, the economics matter even more. Gartner predicts that over 40% of agentic AI projects will be canceled by the end of 2027, citing escalating costs, unclear business value, and inadequate risk controls. A credible baseline won’t guarantee success, but without one, proving the business value becomes considerably harder.
At ShipHero, using our internal support metrics, I saw what that sequence could produce. Over 12 months after deploying AI with a structured human-review loop, time to first response fell from 16 hours to 2.9 hours, final resolution time from 10 days to 3 days, cost to serve fell 30%, and CSAT increased from 65% to 98%. My team worked in a fixed order: analyze the volume, sort it, document the repeatable resolutions, then automate.
The setup I'd build today goes one step further. It pairs internal documentation with a curated, permissioned layer of engineering issue history, so the automation can recognize known defects and approved workarounds alongside standard how-to questions. The goal isn’t to automate every support contact. It’s to determine which contacts should never have reached support, which genuinely require support, and which of those can be resolved safely at a lower unit cost.
Where to start
If your team can produce monthly volume by category, cost per contact, and a capacity model against your SLAs, you're ready to evaluate automation on its merits. If they can't, build those first.
The operations section of the post-sales scorecard covers these questions and takes a couple of minutes. Send the finance section to your CFO while you're at it.
